
1
01
Define the decisions
We clarify what leaders and teams need to decide weekly, monthly, and quarterly.
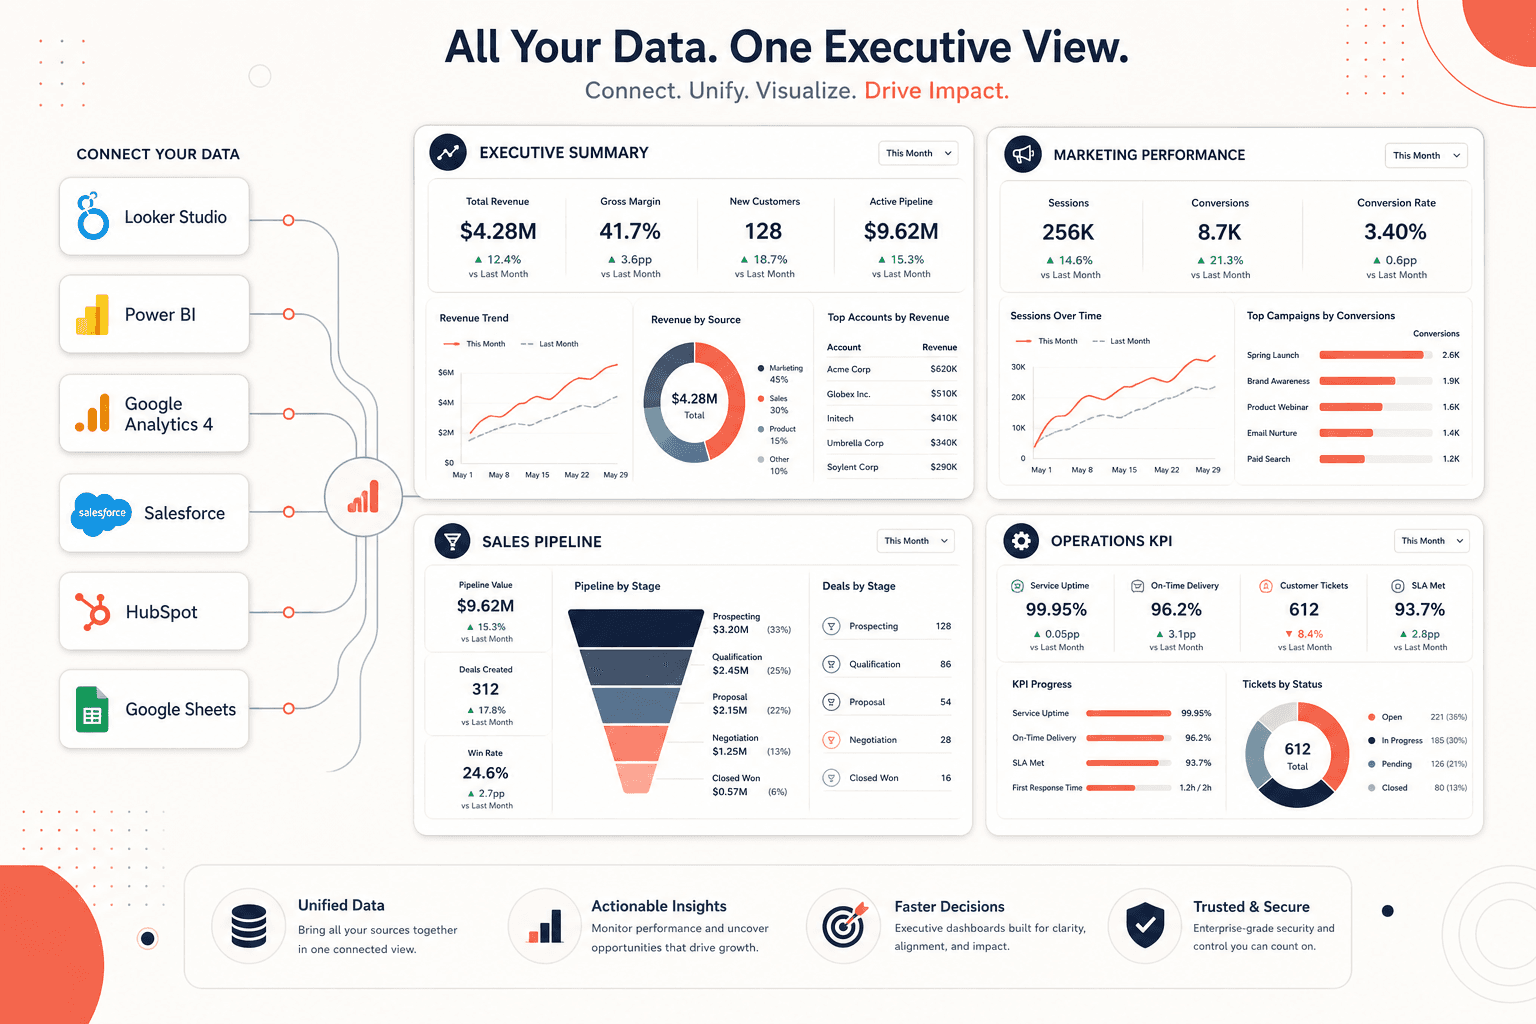
We build dashboards and reporting systems that turn scattered data into clear decisions across marketing, sales, operations, and leadership.
Core promise
Stop managing your business from spreadsheets, screenshots, and disconnected reports.
Book the right calendar
Choose a time on the Business Transformation calendar, or share your contact information and project context below.
Business Transformation calendar
Free 20-minute consultation
Send project details
The link field is optional. Add your existing website, CRM page, funnel, dashboard, or reference link if it helps explain the work.
businesses transformed
hours saved monthly
operations framework
The friction
We turn the messy middle of your operation into a visible, owned, measurable system.
Reports are spread across multiple tools
Marketing data does not connect to sales results
Teams spend too much time preparing reports manually
Owners cannot see performance in real time
Different departments use different numbers
Reports show activity but not business impact
System map
The reporting system turns disconnected sources into focused KPI views for leadership and teams.
Lead sources
Conversion rate
Pipeline value
Cost per qualified lead
Follow-up speed
Revenue by channel
What we build
Looker Studio dashboards
Power BI dashboards
GA4 reporting views
Salesforce reports
CRM dashboards
KPI scorecards
Executive dashboards
Marketing performance reports
Sales pipeline reports
Operations reporting views
What you get by the end
The goal is to leave your team with something usable, measurable, and easier to improve.
A working dashboard your team can use weekly
Clear KPI definitions across leadership and teams
Cleaner reporting views for sales, marketing, and operations
Less manual reporting work before meetings
A clearer way to decide what to cut, fix, or scale
Process
Part of OPS Architect™, built around process visibility, system integration, and performance metrics for growing businesses.
We clarify what leaders and teams need to decide weekly, monthly, and quarterly.
We identify the platforms, events, CRM fields, and reports that matter.
We build focused reporting views for leadership, marketing, sales, and operations.
We reduce manual reporting and improve dashboard clarity as your team starts using the system.
Example outcome
A business may have advertising data in one platform, website data in GA4, sales activity in a CRM, and revenue updates in spreadsheets. A reporting system brings those signals into one practical view.
A practical step toward a cleaner business operating system.
A practical step toward a cleaner business operating system.
A practical step toward a cleaner business operating system.
Before you delay this
Manual reports often arrive late and vary by person. A reporting system creates shared visibility and repeatable decision views.
The build starts by defining KPI logic and source-of-truth rules so teams stop arguing over different numbers.
That is usually the reason to start. We map the current mess first, then improve the highest-impact workflow.
Most problems are not caused by missing tools. They come from unclear process, weak ownership, and disconnected handoffs.
FAQ
We can work with reporting tools like Looker Studio, Power BI, GA4, Salesforce reports, CRM dashboards, and custom dashboard setups depending on the business need.
No. A strong reporting system also includes KPI definitions, data cleanup, tracking logic, and a reporting process your team can maintain.
In many cases, yes. The level of automation depends on your tools, data sources, and integration options.
Related systems
Align marketing, sales, CRM, automation, reporting, and operations into one revenue system built to reduce missed opportunities and improve visibility.
Eliminate repetitive work with business automation systems, workflow design, API integrations, Zapier, n8n, CRM automation, and process optimization.
Generate qualified leads consistently with a marketing growth system covering Google Ads, Meta Ads, tracking, attribution, automation, and reporting.
Next step
Book a free consultation and tell us what you want to improve. We will review your current setup and recommend the clearest next step.
Instant answers
Get help with services, pricing, or connect with our team.